-
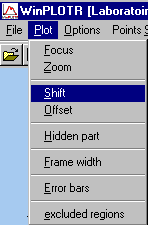 ,
, 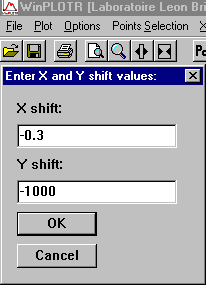 to shift graphically X and Y
values towards the first data file (graphical result)
to shift graphically X and Y
values towards the first data file (graphical result)
-
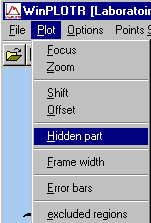 to manage the hidden parts
(graphical result)
to manage the hidden parts
(graphical result)
-
 ,
,  and
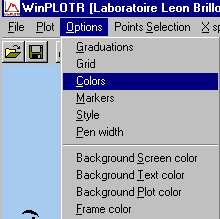
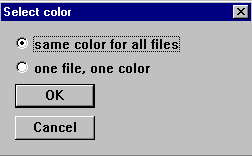
and 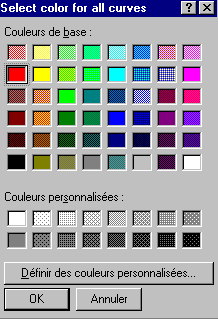 to select a common color for all the data files
(graphical result)
to select a common color for all the data files
(graphical result)
-
 ,
,  and
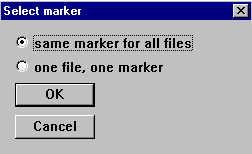
and 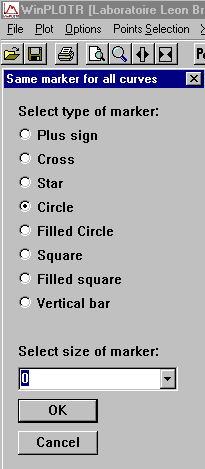 to select a common marker for all the data files
(graphical result)
to select a common marker for all the data files
(graphical result)